Australia and fire are inseparable. For millennia, bushfires have shaped our landscapes, ecology, and communities. But as our climate changes and populations grow along bushland fringes, understanding fire patterns has never been more important.
I’ve built an interactive dashboard that explores over 50 years of fire history in New South Wales—from 1970 to 2024. Using data from NSW’s Department of Planning, Industry and Environment, it tells the story of where, when, and how fires have burned across the state.
What the Data Reveals
Since 1970, NSW has recorded 18,814 fire events, burning more than 15 million hectares—roughly 2% of Australia’s entire landmass. These fires fall into two categories: wildfires (11,503 events) which have burnt 14 million hectares, and prescribed burns (7,311 events) used for hazard reduction, clearing 1.8 million hectares.
The numbers alone don’t capture the human cost. The dashboard documents the deadliest fires, including the Badja Forest Road fire that claimed six lives during Black Summer, and the Green Wattle Creek fire that killed two volunteer firefighters when a tree struck their tanker.
Patterns in Time and Space
The visualisations reveal several clear patterns:
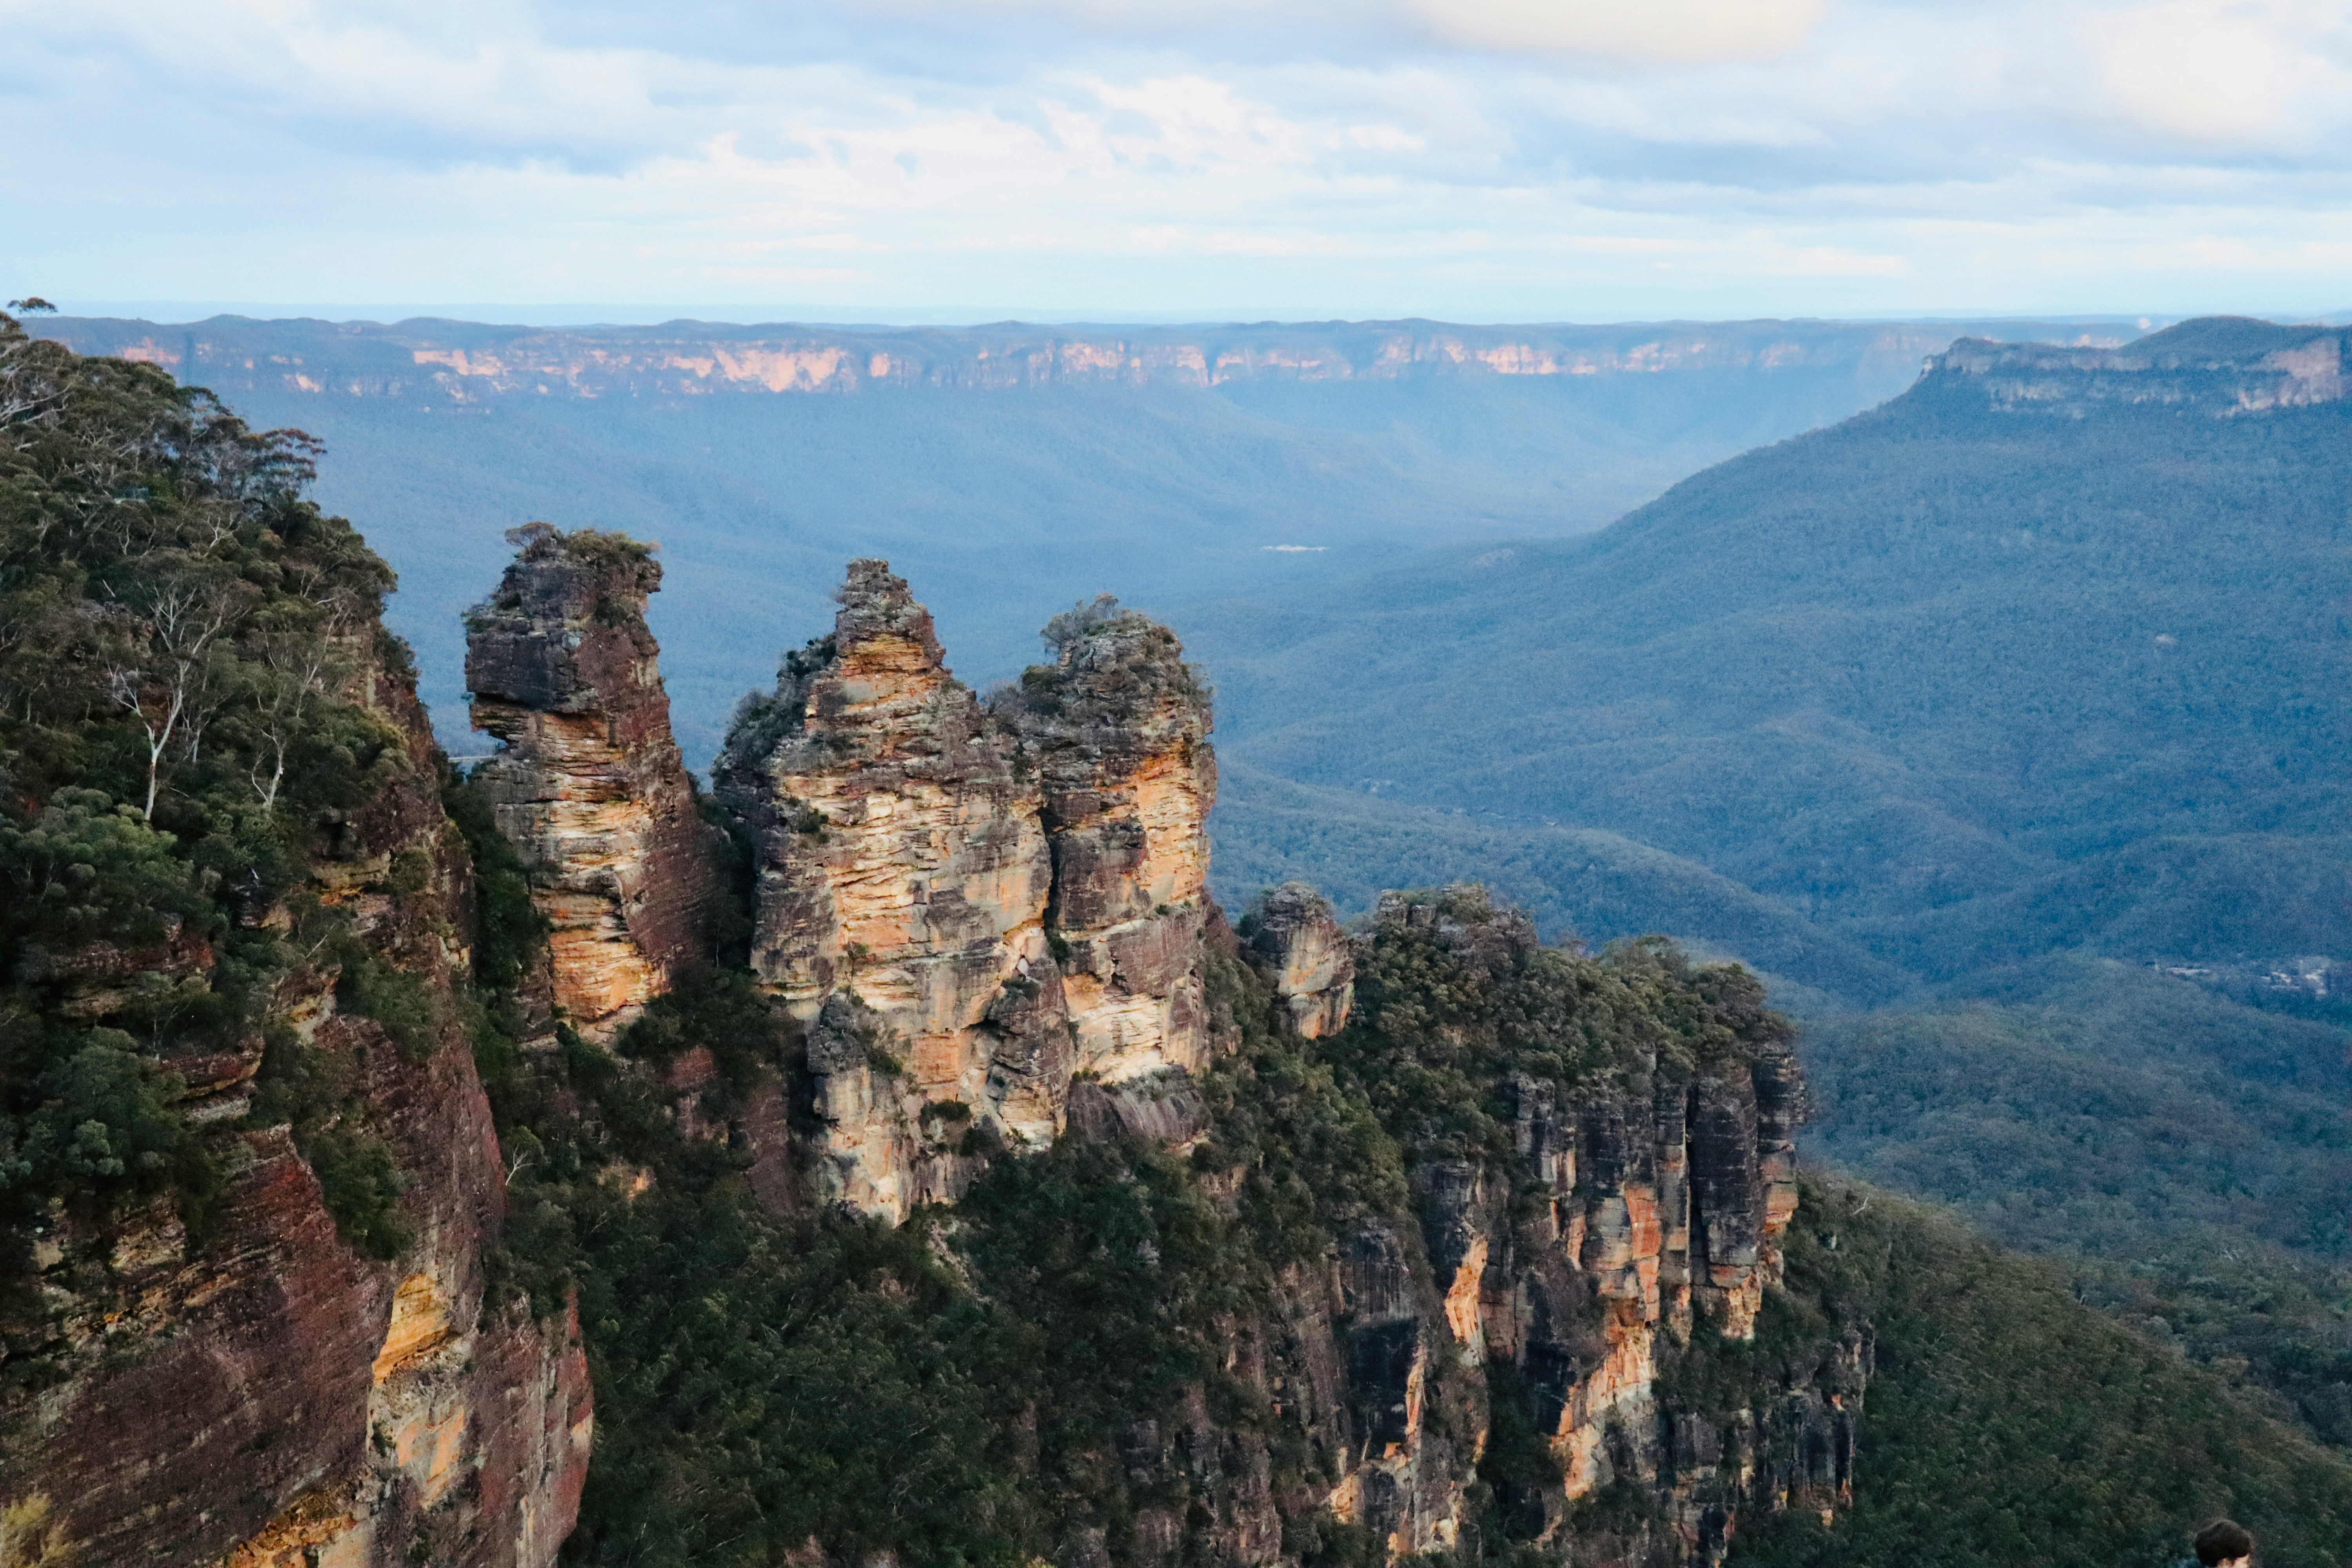
Geographic clustering shows fires concentrate heavily along coastal ranges where eucalypt forests meet urban development. The Blue Mountains and Central Coast are among the most fire-prone areas, with some locations experiencing dozens of fire events over the period.
Seasonal cycles are stark—summer and early autumn (December to March) dominate fire activity. But the 2019-2020 season broke patterns with unprecedented late-spring fires, signalling how changing conditions are shifting traditional fire seasons.
Drought years stand out. Wildfire frequency spikes dramatically during major droughts, particularly 2001-2002 and 2019-2020. Meanwhile, prescribed burns maintain a relatively steady baseline as fire services work to reduce fuel loads.
The Black Summer Context
The 2015-2020 period saw the most area burnt in any five-year window, driven entirely by the catastrophic Black Summer fires of 2019-2020. That season alone burnt over 5 million hectares—dwarfing every previous year on record.
Three fires during Black Summer deserve particular attention. The Gospers Mountain fire, started by a single lightning strike, ultimately burned 512,626 hectares after merging with five other fires into a megablaze exceeding one million hectares. The Currowan fire earned the name “The Forever Fire” for its 74-day duration. The Badja Forest Road fire travelled 40 kilometres in hours under catastrophic conditions, destroying 418 homes around Cobargo on New Year’s Eve.
Only 87 fires since 1970 have exceeded 50,000 hectares. Nearly all sparked from lightning strikes in remote bushland during extreme drought conditions. The dashboard shows how these mega-fires cluster in summer months when temperatures peak and fuel is driest.
Why This Matters
This isn’t just historical data—it’s a window into our future. Fire seasons now start earlier, last longer, and burn with unprecedented intensity. Understanding these patterns helps us prepare.
The dashboard shows how fires behave under different conditions, where they’re most likely to occur, and which periods have been most destructive. For anyone living in NSW or interested in fire management, these patterns matter.
It’s also worth noting what this data doesn’t capture. Historical records, especially pre-1990s, vary in accuracy. Fire boundaries are approximations. Some casualties may be unrecorded. The true human toll of these fires extends far beyond the numbers—displaced communities, destroyed homes, psychological trauma, and ecosystems fundamentally altered.
Building the Dashboard
I built this using Observable Framework with data from NSW’s Department of Planning, Industry and Environment. The dataset includes every recorded fire since 1970, with details on location, size, type, and timing. I’ve supplemented this with research from official inquiries and historical records to document casualties and home losses for the largest fires.
The goal was to make complex fire data accessible and interactive. You can explore specific years, compare wildfire versus prescribed burn patterns, see seasonal variations, and understand which areas face the highest risk.
Looking Ahead
Fire is part of Australia’s identity. Aboriginal Australians used fire as a land management tool for over 60,000 years. But the scale and intensity of modern fires—driven by climate change, fuel accumulation, and expanding urban-bushland interfaces—presents challenges we’re still learning to navigate.
This dashboard doesn’t offer solutions, but it does offer context. By seeing how fires have behaved over five decades, we can better understand what we’re facing and where we need to focus our efforts in fire management, hazard reduction, and community preparedness.
Explore the dashboard at mitchelllisle.github.io/fires-nsw-dashboard and see what patterns emerge from half a century of fire history.
Explore the dashboard: History of Bushfires in NSW
Data source: NSW DPIE Fire History Dataset